Java Streams: A Comprehensive Guide


Java Streams, introduced in Java 8, have revolutionized the way developers work with data collections. They provide a concise and expressive way to perform operations on sequences of data, making code more readable and maintainable. In this detailed tutorial, we’ll explore Java Streams from the ground up, covering everything from the basics to advanced techniques.

Table of Contents

  1. Introduction to Java Streams
  2. Creating Streams
    • 2.1. From Collections
    • 2.2. From Arrays
    • 2.3. Stream.of
    • 2.4. Stream.builder
  3. Intermediate Operations
    • 3.1. Filter
    • 3.2. Map
    • 3.3. FlatMap
    • 3.4. Sorted
    • 3.5. Peek
  4. Terminal Operations
    • 4.1. forEach
    • 4.2. toArray
    • 4.3. collect
    • 4.4. reduce
    • 4.5. min and max
    • 4.6. count
  5. Parallel Streams
  6. Stream API Best Practices
  7. Advanced Stream Techniques
    • 7.1. Custom Collectors
    • 7.2. Stream of Streams
    • 7.3. Grouping and Partitioning
  8. Real-World Examples
    • 8.1. Filtering Data
    • 8.2. Mapping Data
    • 8.3. Aggregating Data
  9. Performance Considerations
  10. Conclusion

1. Introduction to Java Streams

Java Streams are a powerful addition to the Java programming language, designed to simplify the manipulation of collections and arrays. They allow you to perform operations like filtering, mapping, and reducing in a more functional and declarative way.

Key characteristics of Java Streams:

  • Sequence of Data: Streams are a sequence of elements, whether from collections, arrays, or other sources.
  • Functional Style: Operations on streams are expressed as functions, promoting a functional programming paradigm.
  • Lazy Evaluation: Streams are evaluated on demand, making them efficient for large datasets.
  • Parallel Processing: Streams can easily be processed in parallel to leverage multi-core processors.

2. Creating Streams

2.1. From Collections

You can create a stream from a collection using the stream() method:

List<String> names = Arrays.asList("Alice", "Bob", "Charlie", "David");
Stream<String> nameStream = names.stream();

2.2. From Arrays

Arrays can be converted into streams using Arrays.stream():

String[] colors = { "Red", "Green", "Blue" };
Stream<String> colorStream = Arrays.stream(colors);

2.3. Stream.of

To create a stream from individual elements, use Stream.of():

Stream<Integer> numberStream = Stream.of(1, 2, 3, 4, 5);

2.4. Stream.builder

For dynamic stream creation, employ a Stream.Builder:

Stream.Builder<String> builder = Stream.builder();
builder.accept("One");
builder.accept("Two");
Stream<String> customStream = builder.build();

3. Intermediate Operations

Intermediate operations are used to transform or filter data within a stream.

3.1. Filter

The filter operation allows you to select elements that meet a specific condition:

Stream<Integer> numbers = Stream.of(1, 2, 3, 4, 5);
Stream<Integer> evenNumbers = numbers.filter(n -> n % 2 == 0);

3.2. Map

map transforms elements by applying a function to each element:

Stream<String> names = Stream.of("Alice", "Bob", "Charlie");
Stream<Integer> nameLengths = names.map(String::length);

3.3. FlatMap

flatMap is used to flatten nested streams into a single stream:

Stream<List<Integer>> nestedStream = Stream.of(Arrays.asList(1, 2), Arrays.asList(3, 4));
Stream<Integer> flattenedStream = nestedStream.flatMap(Collection::stream);

3.4. Sorted

You can sort elements using the sorted operation:

Stream<String> names = Stream.of("Charlie", "Alice", "Bob");
Stream<String> sortedNames = names.sorted();

3.5. Peek

peek allows you to perform an action on each element without modifying the stream:

Stream<Integer> numbers = Stream.of(1, 2, 3);
Stream<Integer> peekedNumbers = numbers.peek(System.out::println);

4. Terminal Operations

Terminal operations produce a result or a side-effect and trigger the execution of the stream.

4.1. forEach

The forEach operation performs an action on each element:

Stream<String> names = Stream.of("Alice", "Bob", "Charlie");
names.forEach(System.out::println);

4.2. toArray

toArray converts a stream into an array:

Stream<Integer> numbers = Stream.of(1, 2, 3);
Integer[] numArray = numbers.toArray(Integer[]::new);

4.3. collect

The collect operation accumulates elements into a collection:

Stream<String> names = Stream.of("Alice", "Bob", "Charlie");
List<String> nameList = names.collect(Collectors.toList());

4.4. reduce

reduce combines the elements of a stream into a single result:

Stream<Integer> numbers = Stream.of(1, 2, 3, 4, 5);
Optional<Integer> sum = numbers.reduce(Integer::sum);

4.5. min and max

You can find the minimum and maximum elements using min and max:

Stream<Integer> numbers = Stream.of(1, 2, 3, 4, 5);
Optional<Integer> min = numbers.min(Integer::compareTo);
Optional<Integer> max = numbers.max(Integer::compareTo);

4.6. count

count returns the number of elements in the stream:

Stream<String> names = Stream.of("Alice", "Bob", "Charlie");
long count = names.count();

5. Parallel Streams

Java Streams can be easily parallelized to take advantage of multi-core processors. You can convert a sequential stream to a parallel stream using the parallel method:

Stream<Integer> numbers = Stream.of(1, 2, 3, 4, 5);
Stream<Integer> parallelNumbers = numbers.parallel();

Be cautious when using parallel streams, as improper usage can lead to performance issues and race conditions.

6. Stream API Best Practices

To write clean and efficient code with Java Streams, follow these best practices:

  • Keep Streams Stateless: Avoid modifying variables from outside the lambda expressions used in stream operations.
  • Choose Appropriate Data Structures: Use the right data structure for your needs to optimize stream performance.
  • Lazy Evaluation: Use intermediate operations to filter and transform data before calling terminal operations to minimize unnecessary work.
  • Avoid Side Effects: Keep terminal operations clean and avoid side effects for better code maintainability.

7. Advanced Stream Techniques

7.1. Custom Collectors

You can create custom collectors to perform advanced data aggregations:

List<Person> people = ...;
Map<Gender, List<Person>> peopleByGender = people.stream()
    .collect(Collectors.groupingBy(Person::getGender));

7.2. Stream of Streams

Streams can be nested, allowing for more complex data processing:

Stream<List<Integer>> listOfLists = ...;
Stream<Integer> flattenedStream = listOfLists.flatMap(List::stream);

7.3. Grouping and Partitioning

The groupingBy and partitioningBy collectors enable advanced data grouping:

Map<Gender, List<Person>> peopleByGender = people.stream()
    .collect(Collectors.groupingBy(Person::getGender));

8. Real-World Examples

Let’s explore some real-world scenarios where Java Streams shine:

8.1. Filtering Data

Filtering a list of products by price and category:

List<Product> filteredProducts = products.stream()
    .filter(p -> p.getPrice() < 50 && p.getCategory().equals("Electronics"))
    .collect(Collectors.toList());

8.2. Mapping Data

Calculating the average salary of employees in a department:

double averageSalary = employees.stream()
    .filter(e -> e.getDepartment().equals("HR"))
    .mapToDouble(Employee::getSalary)
    .average()
    .orElse(0.0);

8.3. Aggregating Data

Finding the most popular tags among a list of articles:

Map<String, Long> tagCounts = articles.stream()
    .flatMap(article -> article.getTags().stream())
    .collect(Collectors.groupingBy(Function.identity(), Collectors.counting()));

9. Performance Considerations

While Streams offer convenience, improper use can impact performance. Be mindful of:

  • Stream Size: Large data sets may lead to excessive memory usage.
  • Parallel Streams: Use with caution; not all tasks benefit from parallelism.
  • Statelessness: Ensure lambda expressions used in stream operations are stateless.
  • Avoiding Excessive Intermediate Operations: Minimize unnecessary filtering and mapping.

10. Conclusion

Java Streams are a versatile and powerful tool for working with data in a functional and declarative manner. By mastering the concepts, operations, and best practices outlined in this tutorial, you’ll be well-equipped to write clean, efficient, and expressive code that makes the most of Java’s stream processing capabilities.

Happy coding!

Elasticsearch, Logstash, and Kibana – ELK Stack


If you’re dealing with a large amount of data, you’ll quickly realize how important it is to have an efficient way to store, manage, and analyze it. The ELK stack is a popular solution for this problem. It’s an open-source software stack that includes Elasticsearch, Logstash, and Kibana. This tutorial will provide an overview of what the ELK stack is and how you can use it to manage your data.

What is the ELK stack?

The ELK stack is a collection of three open-source software tools: Elasticsearch, Logstash, and Kibana. These tools are designed to work together to help you store, search, and analyze large amounts of data.

  • Elasticsearch: Elasticsearch is a search engine based on the Lucene library. It allows you to store, search, and analyze data in real-time. Elasticsearch can handle a large amount of data, and it’s highly scalable. It’s designed to be fast and efficient, making it ideal for use cases where speed and real-time search are critical.
  • Logstash: Logstash is a data processing pipeline that allows you to ingest, transform, and enrich data. It’s designed to handle a wide range of data types and formats, making it ideal for processing log data, system metrics, and other types of data.
  • Kibana: Kibana is a data visualization and analysis tool. It allows you to create custom dashboards and visualizations, making it easy to understand and analyze your data. Kibana also integrates with Elasticsearch, allowing you to search and analyze data in real-time.

How to use the ELK stack

Using the ELK stack is relatively straightforward. Here are the basic steps:

Step 1: Install the ELK stack

Installing Elasticsearch

The first tool in the stack is Elasticsearch, which is a distributed search and analytics engine. To install Elasticsearch, follow the steps below:

  1. Visit the Elasticsearch download page and select the appropriate version for your operating system.
  2. Extract the downloaded archive to a directory of your choice.
  3. Open a terminal and navigate to the Elasticsearch directory.
  4. Start Elasticsearch by running the following command: ./bin/elasticsearch

Installing Logstash

The next tool in the stack is Logstash, which is a data processing pipeline that ingests data from multiple sources, transforms it, and sends it to a destination. To install Logstash, follow the steps below:

  1. Visit the Logstash download page and select the appropriate version for your operating system.
  2. Extract the downloaded archive to a directory of your choice.
  3. Open a terminal and navigate to the Logstash directory.
  4. Start Logstash by running the following command: ./bin/logstash

Installing Kibana

The final tool in the stack is Kibana, which is a web-based visualization tool that allows users to interact with the data stored in Elasticsearch. To install Kibana, follow the steps below:

  1. Visit the Kibana download page and select the appropriate version for your operating system.
  2. Extract the downloaded archive to a directory of your choice.
  3. Open a terminal and navigate to the Kibana directory.
  4. Start Kibana by running the following command: ./bin/kibana

Step 2: Configure Elasticsearch

Once you have installed the ELK stack, the next step is to configure Elasticsearch. You will need to set up an index, which is like a database in Elasticsearch. An index contains one or more documents, which are like rows in a traditional database. You can think of an index as a way to organize your data.

  1. Open the Elasticsearch configuration file (typically located at /etc/elasticsearch/elasticsearch.yml), and make necessary modifications such as cluster name, network settings, and heap size.
  2. Start the Elasticsearch service by running the appropriate command for your operating system (sudo service elasticsearch start for Linux, or .\bin\elasticsearch.bat for Windows).
  3. Verify the Elasticsearch installation by accessing http://localhost:9200 in your web browser. You should see a JSON response with information about your Elasticsearch cluster.

Step 3: Ingest data with Logstash

The next step is to ingest data with Logstash. Logstash allows you to parse and transform data from various sources, including logs, metrics, and other data types. You can use Logstash to filter and transform data, so it’s in the format that Elasticsearch expects.

  1. Create a Logstash configuration file (e.g., myconfig.conf) that defines the input, filter, and output sections. The input section specifies the data source (e.g., file, database, or network stream). The filter section allows data transformation, parsing, and enrichment. The output section defines where the processed data will be sent (typically Elasticsearch).
  2. Start Logstash and specify your configuration file: bin/logstash -f myconfig.conf. Logstash will start reading data from the input source, apply filters, and send the processed data to the specified output.
  3. Verify the Logstash pipeline by monitoring the Logstash logs and checking Elasticsearch to ensure that data is being ingested properly.

Step 4: Visualize data with Kibana

Finally, you can use Kibana to visualize and analyze your data. Kibana allows you to create custom dashboards and visualizations, so you can easily understand and analyze your data.

  1. Start the Kibana service by running the appropriate command for your operating system (sudo service kibana start for Linux, or .\bin\kibana.bat for Windows).
  2. Access Kibana by visiting http://localhost:5601 in your web browser.
  3. Configure an index pattern in Kibana to define which Elasticsearch indices you want to explore. Follow the step-by-step instructions provided in the Kibana UI.
  4. Once the index pattern is configured, navigate to the Discover tab in Kibana. Here, you can search, filter, and visualize your data. Experiment with various visualizations, such as bar charts, line charts, and maps, to gain insights into your data.

Conclusion

The ELK stack is a powerful tool for managing large amounts of data. It’s designed to be fast, efficient, and scalable, making it ideal for use cases where speed and real-time search are critical. By following the steps outlined in this tutorial, you can get started with the ELK stack and start managing your data more efficiently.

You have successfully set up the ELK stack and are now equipped to manage, process, and analyze your data efficiently. Elasticsearch provides a scalable and high-performance data storage and retrieval solution, Logstash enables data ingestion and transformation, and Kibana empowers you to visualize and explore your data effectively.

Building Reactive Applications with Vert.x: A Comprehensive Tutorial


In today’s fast-paced, highly concurrent world, building scalable and reactive applications is a necessity. Vert.x, a powerful toolkit for building reactive applications on the Java Virtual Machine (JVM), provides developers with an excellent framework to achieve this. In this tutorial, we will explore the fundamentals of Vert.x and guide you through building a reactive application from scratch.

Table of Contents:

  1. What is Vert.x?
  2. Setting Up the Development Environment
  3. Understanding Vert.x Core Concepts
    • 3.1. Verticles
    • 3.2. Event Bus
    • 3.3. Asynchronous Programming Model
  4. Building a Simple Vert.x Application
    • 4.1. Creating a Maven Project
    • 4.2. Writing a Verticle
    • 4.3. Deploying and Running the Verticle
  5. Scaling Vert.x Applications
    • 5.1. Vert.x Clustering
    • 5.2. High Availability
  6. Integrating with Other Technologies
    • 6.1. Working with HTTP and WebSockets
    • 6.2. Integrating with Databases
    • 6.3. Reactive Messaging with Apache Kafka
  7. Unit Testing Vert.x Applications
    • 7.1. Vert.x Unit Testing Framework
    • 7.2. Mocking Dependencies
  8. Deploying Vert.x Applications
    • 8.1. Packaging Vert.x Applications
    • 8.2. Running Vert.x on Docker
    • 8.3. Deploying to the Cloud
  9. Monitoring and Debugging Vert.x Applications
    • 9.1. Logging and Metrics
    • 9.2. Distributed Tracing with OpenTelemetry
  10. Conclusion

Section 1: What is Vert.x?

Vert.x is an open-source, reactive, and polyglot toolkit designed for building scalable and high-performance applications. It provides a powerful and flexible framework for developing event-driven and non-blocking applications on the Java Virtual Machine (JVM). Vert.x enables developers to create reactive systems that can handle a large number of concurrent connections and process events efficiently.

At its core, Vert.x embraces the principles of the Reactive Manifesto, which include responsiveness, scalability, resilience, and message-driven architecture. It leverages an event-driven programming model, allowing developers to build applications that are highly responsive to incoming events and messages.

Key Features of Vert.x:

  1. Polyglot Support: Vert.x supports multiple programming languages, including Java, Kotlin, JavaScript, Groovy, Ruby, and Ceylon. This flexibility allows developers to leverage their language of choice while benefiting from Vert.x’s features.
  2. Event Bus: The Vert.x event bus enables communication and coordination between different components of an application, both within a single instance and across distributed instances. It supports publish/subscribe and point-to-point messaging patterns, making it easy to build decoupled and scalable systems.
  3. Asynchronous and Non-Blocking: Vert.x promotes non-blocking I/O operations and asynchronous programming. It utilizes a small number of threads to handle a large number of concurrent connections efficiently. This enables applications to scale and handle high loads without incurring the overhead of traditional thread-per-connection models.
  4. Reactive Streams Integration: Vert.x seamlessly integrates with Reactive Streams, a specification for asynchronous stream processing with non-blocking backpressure. This integration allows developers to build reactive applications that can handle backpressure and efficiently process streams of data.
  5. Web and API Development: Vert.x provides a rich set of APIs and tools for building web applications and RESTful APIs. It supports the creation of high-performance HTTP servers, WebSocket communication, and the integration of various web technologies.
  6. Clustering and High Availability: Vert.x offers built-in support for clustering, allowing applications to scale horizontally by running multiple instances across multiple nodes. It provides mechanisms for event bus clustering, distributed data structures, and failover, ensuring high availability and fault tolerance.
  7. Integration Ecosystem: Vert.x integrates with various technologies and frameworks, including databases, messaging systems (such as Apache Kafka and RabbitMQ), reactive streams implementations, service discovery mechanisms, and more. This enables developers to leverage existing tools and services seamlessly.

Vert.x is well-suited for developing a wide range of applications, including real-time systems, microservices, APIs, IoT applications, and reactive web applications. Its lightweight and modular architecture, combined with its reactive nature, makes it an excellent choice for building scalable and responsive applications that can handle heavy workloads and concurrent connections.

Whether you’re a Java developer or prefer other JVM-compatible languages, Vert.x offers a powerful toolkit to create reactive, event-driven applications that can meet the demands of modern distributed systems.

Section 2: Setting Up the Development Environment

Setting up the development environment for Vert.x involves a few essential steps. Here’s a step-by-step guide to getting started:

Step 1: Install Java Development Kit (JDK)

  • Ensure that you have the latest version of JDK installed on your system. Vert.x requires Java 8 or higher. You can download the JDK from the Oracle website or use OpenJDK, which is a free and open-source alternative.

Step 2: Install Apache Maven (optional)

  • While not mandatory, using Apache Maven simplifies the management of dependencies and building Vert.x projects. You can download Maven from the Apache Maven website and follow the installation instructions specific to your operating system.

Step 3: Set up a Project

  • Create a new directory for your Vert.x project. Open a terminal or command prompt and navigate to the directory you just created.

Step 4: Initialize a Maven Project (optional)

  • If you chose to use Maven, you can initialize a new Maven project by running the following
mvn archetype:generate -DgroupId=com.example -DartifactId=my-vertx-app -DarchetypeArtifactId=maven-archetype-quickstart -DinteractiveMode=false

This command creates a basic Maven project structure with a sample Java class.

Step 5: Add Vert.x Dependencies

Open the pom.xml file in your project directory (if using Maven) and add the following dependencies:

<dependencies>
    <dependency>
        <groupId>io.vertx</groupId>
        <artifactId>vertx-core</artifactId>
        <version>4.1.1</version>
    </dependency>
</dependencies>

This configuration adds the Vert.x core dependency to your project.

Step 6: Build the Project (optional)

  • If you’re using Maven, you can build your project by running the following command:
mvn clean package

This command compiles your code, resolves dependencies, and creates a JAR file in the target directory.

Step 7: Start Coding

  • You’re now ready to start developing with Vert.x. Create your Verticle class, which represents a component in a Vert.x application, and implement the necessary logic.

Step 8: Run the Application

To run a Vert.x application, you can use the following command in your project directory (assuming you’ve already built the project with Maven):

java -jar target/my-vertx-app-1.0-SNAPSHOT.jar

Replace my-vertx-app-1.0-SNAPSHOT.jar with the actual name of your JAR file.

Congratulations! You have successfully set up your development environment for Vert.x. You can now start building reactive applications using the Vert.x toolkit. Remember to refer to the Vert.x documentation and explore its rich set of features and APIs to harness its full potential. Happy coding!

Section 3: Understanding Vert.x Core Concepts

To effectively work with Vert.x, it’s crucial to understand its core concepts. Let’s explore the key concepts of Vert.x:

  1. Verticles:
    • Verticles are the building blocks of a Vert.x application. They represent individual components or units of work that run concurrently within the Vert.x ecosystem.
    • Verticles are lightweight and can be single-threaded or multi-threaded, depending on the configuration. They communicate with each other through the event bus.
    • Verticles can handle various tasks, such as handling HTTP requests, processing messages, accessing databases, or performing background tasks.
    • Vert.x provides different types of verticles, including standard verticles, worker verticles (for CPU-intensive tasks), and periodic verticles (for scheduled tasks).
  2. Event Bus:
    • The event bus is a powerful communication mechanism provided by Vert.x that allows different verticles to exchange messages asynchronously.
    • Verticles can publish messages to the event bus, and other verticles can subscribe to receive those messages based on different patterns or addresses.
    • The event bus enables loose coupling between verticles, making it easy to build distributed and scalable systems.
    • Vert.x provides different messaging patterns, including publish/subscribe and point-to-point messaging, which can be used with the event bus.
  3. Asynchronous Programming Model:
    • Vert.x promotes an asynchronous programming model, which is fundamental to building reactive applications.
    • Asynchronous programming allows non-blocking execution of tasks, enabling applications to handle high loads and concurrency efficiently.
    • Vert.x APIs are designed to work asynchronously, allowing developers to write non-blocking code that can scale well.
    • Callbacks, futures/promises, and reactive streams are common patterns used in Vert.x to handle asynchronous operations.
  4. Reactive Streams Integration:
    • Vert.x integrates seamlessly with Reactive Streams, a standard for asynchronous stream processing with non-blocking backpressure.
    • Reactive Streams provide a set of interfaces and protocols for building reactive applications that can handle backpressure and efficiently process streams of data.
    • Vert.x includes support for Reactive Streams, enabling developers to use reactive streams implementations like RxJava, Reactor, or CompletableFuture seamlessly within Vert.x applications.

Understanding these core concepts is essential for harnessing the power of Vert.x. With Verticles, the Event Bus, Asynchronous Programming, and Reactive Streams, you can build scalable, responsive, and high-performance applications. By leveraging these concepts, you can create loosely coupled, concurrent systems that efficiently handle large workloads and enable seamless communication between components.

Section 4: Building a Simple Vert.x Application

To build a simple Vert.x application, we will go through the process of creating a basic Verticle, deploying it, and running the application. Follow these steps:

Step 1: Create a Maven Project

  • If you haven’t already set up a Maven project, follow the instructions in the “Setting Up the Development Environment” section to create a new Maven project or use an existing one.

Step 2: Add Vert.x Dependency

  • Open the pom.xml file of your Maven project and add the Vert.x dependency within the <dependencies> section:
<dependency>
    <groupId>io.vertx</groupId>
    <artifactId>vertx-core</artifactId>
    <version>4.1.1</version>
</dependency>
  • This adds the Vert.x core dependency to your project.

Step 3: Create a Verticle

  • In your project, create a new Java class representing your Verticle. For example, you can create a class named MyVerticle.
  • Make sure your class extends io.vertx.core.AbstractVerticle.
  • Override the start() method to define the behavior of your Verticle when it is deployed. For simplicity, let’s print a message to the console:
public class MyVerticle extends AbstractVerticle {

    @Override
    public void start() {
        System.out.println("MyVerticle has been deployed!");
    }
}

Step 4: Deploy and Run the Verticle

  • In your main application class (e.g., App.java), deploy the MyVerticle by creating a Vertx instance and using the deployVerticle() method:
import io.vertx.core.Vertx;

public class App {
    public static void main(String[] args) {
        Vertx vertx = Vertx.vertx();
        vertx.deployVerticle(new MyVerticle());
    }
}

Step 5: Run the Application

  • Compile and run the application using your preferred method (e.g., Maven command or an integrated development environment).
  • Once the application starts, you should see the message “MyVerticle has been deployed!” printed in the console.

Congratulations! You have successfully built a simple Vert.x application. This example demonstrates the basic structure of a Verticle and how to deploy it using the Vertx instance. You can further enhance your application by adding more Verticles, handling HTTP requests, or integrating with other technologies using the Vert.x APIs.

Section 5: Scaling Vert.x Applications

Scaling Vert.x applications is crucial to handle increased workloads and ensure high availability. Vert.x provides several mechanisms for scaling applications. Let’s explore two important aspects of scaling Vert.x applications: Vert.x Clustering and High Availability.

  1. Vert.x Clustering:
    • Vert.x clustering allows you to run multiple Vert.x instances across multiple nodes to distribute the load and handle high concurrency.
    • Clustering is achieved through a built-in event bus, which enables communication between different Vert.x instances running on different nodes.
    • When multiple Vert.x instances are clustered, they form a distributed event bus network, allowing verticles to communicate seamlessly.
    • To enable clustering, you need to configure your Vert.x instances to join the same cluster by specifying a cluster manager implementation.
    • Vert.x provides different cluster manager implementations, such as Hazelcast, Apache Ignite, Infinispan, and more, that handle the management and coordination of the clustered instances.
    • By leveraging clustering, you can horizontally scale your Vert.x application by adding more nodes to the cluster, enabling it to handle higher workloads and providing fault tolerance.
  2. High Availability:
    • High availability ensures that your Vert.x application remains operational even in the face of failures.
    • Vert.x provides features and best practices to achieve high availability in different scenarios:
      • Circuit Breaker Pattern: Vert.x offers a built-in circuit breaker pattern implementation, allowing you to protect your application from cascading failures when dealing with remote services. It helps to manage failure thresholds, timeouts, and retries.
      • Reactive Streams and Backpressure: Vert.x integrates with Reactive Streams, which enables efficient handling of streams of data with non-blocking backpressure. This helps to prevent overloading downstream systems and ensures resilience and stability in the face of varying workloads.
      • Fault Tolerance: Vert.x provides mechanisms to handle failures and recover from them. For example, when a verticle fails, Vert.x can automatically redeploy it to ensure that the system continues running smoothly. Additionally, you can leverage cluster-wide shared data structures to maintain the state and recover from failures.
      • Monitoring and Alerting: Implement monitoring and alerting mechanisms to detect and respond to any anomalies or failures in your Vert.x application. Utilize logging, metrics, and monitoring tools to gain insights into the application’s health and performance.

By leveraging Vert.x clustering and implementing high availability practices, you can ensure that your application scales effectively and remains resilient to failures. These mechanisms enable your application to handle increased workloads, distribute the load across multiple nodes, and provide fault tolerance and automatic recovery. Proper monitoring and alerting help you identify and address any issues promptly, ensuring the smooth operation of your Vert.x application.

Section 6: Integrating with Other Technologies

Vert.x offers seamless integration with various technologies and frameworks, allowing you to leverage existing tools and services in your applications. Here are some common integration points for Vert.x:

  1. Database Integration:
    • Vert.x provides asynchronous clients and connectors for interacting with different databases, both SQL and NoSQL.
    • For example, you can use the Vert.x JDBC client to connect to relational databases like MySQL, PostgreSQL, or Oracle.
    • Vert.x also provides clients for popular NoSQL databases like MongoDB, Redis, and Apache Cassandra.
    • These database clients allow you to perform asynchronous database operations efficiently and integrate database access with other Vert.x components.
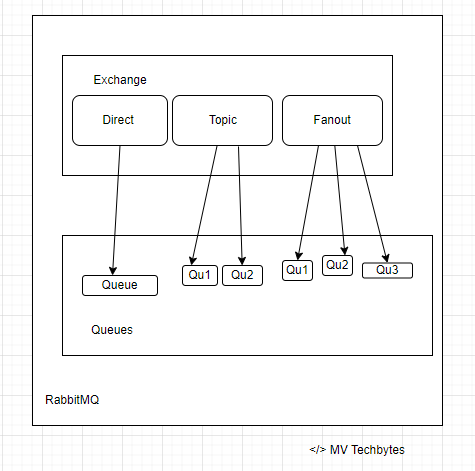
  2. Messaging Systems:
    • Vert.x seamlessly integrates with messaging systems, enabling you to build event-driven and distributed applications.
    • Vert.x provides a unified API for working with message brokers such as Apache Kafka, RabbitMQ, and ActiveMQ.
    • You can use the Vert.x event bus to publish and consume messages from these brokers, enabling communication between different parts of your system or integrating with external systems.
  3. Reactive Streams:
    • Vert.x integrates with Reactive Streams, which is a specification for asynchronous stream processing with non-blocking backpressure.
    • By leveraging Reactive Streams implementations like RxJava, Reactor, or CompletableFuture, you can easily integrate reactive libraries and frameworks into your Vert.x applications.
    • This integration allows you to handle streams of data efficiently and apply reactive patterns across your application.
  4. Service Discovery:
    • Vert.x provides a service discovery mechanism that allows services to discover and interact with each other dynamically.
    • With service discovery, you can register services with associated metadata and retrieve them by name or other attributes.
    • This feature is especially useful in microservices architectures, where services need to discover and communicate with each other without hard-coded dependencies.
  5. Web Technologies:
    • Vert.x offers a powerful set of APIs and tools for building web applications and APIs.
    • It integrates with web technologies like WebSocket, HTTP, and event-driven server-sent events.
    • You can use the Vert.x Web API to handle HTTP requests, build RESTful APIs, serve static files, and implement routing and middleware functionalities.
    • Additionally, Vert.x provides integration with popular web frameworks like Spring WebFlux and Express.js, allowing you to leverage their capabilities within your Vert.x applications.
  6. Authentication and Authorization:
    • Vert.x integrates with authentication and authorization mechanisms, enabling secure access control to your applications.
    • It supports various authentication methods, including basic authentication, OAuth 2.0, and JWT (JSON Web Tokens).
    • Vert.x also provides integration with popular identity providers like Keycloak, Okta, and Google Sign-In.

These are just a few examples of the technologies that can be integrated with Vert.x. Vert.x’s modular and flexible architecture allows you to integrate with a wide range of tools and services, enabling you to leverage existing solutions and build powerful, feature-rich applications. When integrating with external technologies, refer to the Vert.x documentation and specific integration guides for detailed instructions and best practices.

Section 7: Unit Testing Vert.x Applications

Unit testing is an essential practice in software development, and Vert.x provides support for writing unit tests for your Vert.x applications. Let’s explore how you can effectively unit test your Vert.x applications:

  1. Testing Verticles:
    • Verticles are the building blocks of a Vert.x application. You can write unit tests to validate the behavior of individual verticles.
    • To test a verticle, create a test class for it and use a testing framework like JUnit or TestNG.
    • Use the Vert.x Test API to set up and execute your tests. The Vert.x Test API provides utilities for creating Vert.x instances, deploying verticles, and simulating events.
    • You can simulate events on the event bus, mock dependencies, and verify the expected behavior of your verticle.
  2. Mocking Dependencies:
    • When unit testing a verticle, you may need to mock external dependencies such as databases, services, or message brokers.
    • Use mocking frameworks like Mockito or EasyMock to create mock objects for your dependencies.
    • Mock the behavior of these dependencies to simulate different scenarios and ensure the correct interaction between the verticle and its dependencies.
  3. Asynchronous Testing:
    • Vert.x is designed for asynchronous programming, and your tests need to handle asynchronous operations appropriately.
    • Use the Vert.x Test API to write assertions for asynchronous code. For example, you can use the await() method to wait for asynchronous operations to complete.
    • Use the async() method to inform the test framework that the test is asynchronous and provide a completion handler to signal the completion of the test.
  4. Dependency Injection:
    • Vert.x supports dependency injection, and you can use it to improve the testability of your code.
    • Use a dependency injection framework like Google Guice or Spring to manage dependencies in your verticles.
    • In your unit tests, you can provide mock or test-specific implementations of dependencies to ensure controlled testing environments.
  5. Integration Testing:
    • In addition to unit tests, you may also want to perform integration tests to validate the interactions between different components of your Vert.x application.
    • Integration tests involve deploying multiple verticles and simulating real-world scenarios.
    • Use the Vert.x Test API and tools like the embedded Vert.x instance or containers like Docker to set up integration test environments.
    • You can also use tools like WireMock to mock external dependencies and simulate network interactions.

Remember to follow best practices for unit testing, such as testing individual units in isolation, focusing on behavior rather than implementation details, and keeping tests concise and readable.

Vert.x provides a comprehensive testing framework and utilities to support effective unit testing of your applications. By writing unit tests, you can ensure the correctness of your code, detect bugs early, and maintain the quality and stability of your Vert.x applications.

Section 8: Deploying Vert.x Applications

Deploying Vert.x applications involves preparing your application for deployment and choosing the appropriate deployment options. Here are the key steps to deploy a Vert.x application:

  1. Package Your Application:
    • Ensure that your Vert.x application is properly packaged for deployment.
    • Create an executable JAR file that includes all the necessary dependencies.
    • You can use build tools like Maven or Gradle to package your application, which will create a self-contained JAR file.
  2. Choose Deployment Options:
    • Vert.x provides multiple deployment options based on your requirements and the target environment.
    • Standalone Deployment: You can deploy your Vert.x application as a standalone JAR file on a server or a virtual machine.
    • Containerized Deployment: Package your application as a Docker image and deploy it to container orchestration platforms like Kubernetes.
    • Serverless Deployment: If you want to leverage serverless architectures, you can deploy your Vert.x application to platforms like AWS Lambda or Azure Functions.
  3. Configuration Management:
    • Consider how you manage configuration for your Vert.x application in different deployment environments.
    • Externalize configuration using configuration files, environment variables, or configuration servers like Consul or Spring Cloud Config.
    • Make sure your application can read and utilize the configuration from the chosen configuration source.
  4. Scaling and Load Balancing:
    • When deploying your application in a production environment, consider how to scale and load balance your Vert.x instances.
    • Vert.x clustering allows you to run multiple instances of your application across different nodes, distributing the load and ensuring fault tolerance.
    • Use load balancers like Nginx or Apache HTTP Server to distribute incoming traffic across multiple Vert.x instances.
  5. Monitoring and Logging:
    • Set up monitoring and logging for your deployed Vert.x application to gather insights into its performance, health, and potential issues.
    • Use monitoring tools like Prometheus, Grafana, or the Vert.x Metrics API to collect and visualize application metrics.
    • Configure proper logging to capture important events, errors, and debugging information for troubleshooting purposes.
  6. Continuous Integration and Deployment (CI/CD):
    • Automate your deployment process using CI/CD pipelines to streamline and ensure consistent deployments.
    • Integrate your Vert.x application with CI/CD tools like Jenkins, GitLab CI, or AWS CodePipeline to automatically build, test, and deploy your application.

By following these steps and considering the deployment options, configuration management, scaling, monitoring, and automation, you can successfully deploy your Vert.x application and ensure its availability, scalability, and maintainability in various environments.

Section 9: Monitoring and Debugging Vert.x Applications

Monitoring and debugging Vert.x applications are crucial for maintaining their performance, identifying issues, and ensuring their smooth operation. Here are some approaches and tools you can use for monitoring and debugging Vert.x applications:

  1. Logging:
    • Utilize logging frameworks like Log4j, SLF4J, or Vert.x’s built-in logging capabilities to capture important events, errors, and debugging information.
    • Configure logging levels appropriately to balance the level of detail and performance impact.
    • Use log aggregation tools like ELK Stack (Elasticsearch, Logstash, Kibana) or Splunk to collect, search, and visualize log data.
  2. Metrics and Health Checks:
    • Vert.x provides a Metrics API that allows you to collect various performance metrics about your application, such as CPU usage, memory consumption, event loop utilization, and request/response rates.
    • Integrate with monitoring tools like Prometheus, Grafana, or DataDog to collect and visualize these metrics in real-time dashboards.
    • Implement health checks in your application to periodically assess its overall health and availability. Expose endpoints that can be probed by external monitoring systems.
  3. Distributed Tracing:
    • Distributed tracing helps you understand and debug the flow of requests across different components of your Vert.x application, especially in microservices architectures.
    • Tools like Jaeger, Zipkin, or OpenTelemetry can be integrated with Vert.x to provide distributed tracing capabilities.
    • Instrument your code with tracing annotations or APIs to track requests as they pass through different verticles and external services.
  4. Request Logging and Monitoring:
    • Log and monitor incoming requests to your Vert.x application to gain insights into their performance and identify potential bottlenecks.
    • Use tools like Apache HTTP Server or Nginx as reverse proxies to capture request logs and enable advanced logging features.
    • Implement request-level metrics and monitoring to track request/response times, error rates, and throughput.
  5. Debugging Techniques:
    • Vert.x supports remote debugging, allowing you to attach a debugger to running Vert.x instances.
    • Enable remote debugging by adding the appropriate JVM arguments to your application’s startup script or configuration.
    • Use an Integrated Development Environment (IDE) like IntelliJ IDEA, Eclipse, or Visual Studio Code with the Vert.x plugin to connect and debug your running application.
  6. Application Performance Monitoring (APM) Tools:
    • Consider using Application Performance Monitoring (APM) tools like New Relic, AppDynamics, or Dynatrace to gain deeper insights into your Vert.x application’s performance.
    • These tools provide end-to-end visibility, capturing detailed transaction traces, database queries, external service calls, and resource utilization.

Remember to monitor your Vert.x applications in both development and production environments. Understand the performance characteristics of your application and establish baselines to identify deviations and potential issues.

By combining logging, metrics, distributed tracing, request logging, debugging techniques, and APM tools, you can effectively monitor and debug your Vert.x applications, ensuring optimal performance, identifying and resolving issues quickly, and providing a smooth user experience.

Section 10: Conclusion

In conclusion, Vert.x is a powerful and versatile toolkit for building reactive, event-driven applications that can handle high concurrency and scale effectively. In this tutorial, we covered various aspects of Vert.x development, starting from setting up the development environment to deploying and monitoring Vert.x applications.

Apache Kafka vs Apache Flink


Apache Kafka and Apache Flink are two popular open-source tools that can be used for real-time data streaming and processing. While they share some similarities, there are also significant differences between them. In this blog tutorial, we will compare Apache Kafka and Apache Flink to help you understand which tool may be best suited for your needs.

What is Apache Kafka?

Apache Kafka is a distributed streaming platform that is designed to handle high-volume data streams in real-time. Kafka is a publish-subscribe messaging system that allows data producers to send data to a central broker, which then distributes the data to data consumers. Kafka is designed to be scalable, fault-tolerant, and durable, and it can handle large volumes of data without sacrificing performance.

What is Apache Flink?

Apache Flink is an open-source, distributed stream processing framework that is designed to process large amounts of data in real-time. Flink uses a stream processing model, which means that it processes data as it comes in, rather than waiting for all the data to arrive before processing it. Flink is designed to be fault-tolerant and scalable, and it can handle both batch and stream processing workloads.

Comparison of Apache Kafka and Apache Flink Here are some of the key differences between Apache Kafka and Apache Flink:

  1. Data processing model Apache Kafka is primarily a messaging system that is used for data transport and storage. While Kafka does provide some basic processing capabilities, its primary focus is on data transport. Apache Flink, on the other hand, is a full-fledged stream processing framework that is designed for data processing.
  2. Processing speed Apache Kafka is designed to handle high-volume data streams in real-time, but it does not provide any built-in processing capabilities. Apache Flink, on the other hand, is designed specifically for real-time data processing, and it can process data as it comes in, without waiting for all the data to arrive.
  3. Fault tolerance Both Apache Kafka and Apache Flink are designed to be fault-tolerant. Apache Kafka uses replication to ensure that data is not lost if a broker fails, while Apache Flink uses checkpointing to ensure that data is not lost if a task fails.
  4. Scalability Both Apache Kafka and Apache Flink are designed to be scalable. Apache Kafka can be scaled horizontally by adding more brokers to the cluster, while Apache Flink can be scaled horizontally by adding more nodes to the cluster.
  5. Use cases Apache Kafka is commonly used for data transport and storage in real-time applications, such as log aggregation, metrics collection, and messaging. Apache Flink is commonly used for real-time data processing, such as stream analytics, fraud detection, and real-time recommendations.

Conclusion:

Apache Kafka and Apache Flink are both powerful tools that can be used for real-time data streaming and processing. Apache Kafka is primarily a messaging system that is used for data transport and storage, while Apache Flink is a full-fledged stream processing framework that is designed for data processing. Both tools are designed to be fault-tolerant and scalable, but they have different use cases. If you need a messaging system for data transport and storage, Apache Kafka may be the better choice. If you need a full-fledged stream processing framework for real-time data processing, Apache Flink may be the better choice.

Sort Employee Objects on Age


This program defines an Employee class with properties of name, id, and age, and implements the Comparable interface to enable sorting by age. The main method creates a list of 100 employee objects and sorts them based on age using the Collections.sort method. Finally, the sorted list of employees is printed to the console.

import java.util.ArrayList;
import java.util.Collections;
import java.util.Comparator;
import java.util.List;

public class Employee implements Comparable<Employee> {
    private String name;
    private String id;
    private int age;

    public Employee(String name, String id, int age) {
        this.name = name;
        this.id = id;
        this.age = age;
    }

    public String getName() {
        return name;
    }

    public String getId() {
        return id;
    }

    public int getAge() {
        return age;
    }

    @Override
    public int compareTo(Employee other) {
        return Integer.compare(this.age, other.age);
    }

    @Override
    public String toString() {
        return "Employee{" +
                "name='" + name + '\'' +
                ", id='" + id + '\'' +
                ", age=" + age +
                '}';
    }

    public static void main(String[] args) {
        // Create a list of 100 employee objects
        List<Employee> employees = new ArrayList<>();
        employees.add(new Employee("John", "1001", 25));
        employees.add(new Employee("Jane", "1002", 30));
        employees.add(new Employee("Bob", "1003", 28));
        // ... and so on for the other 97 employees

        // Sort the list of employees based on age (ascending order)
        Collections.sort(employees);
        System.out.println(employees);
    }
}

Apache Kafka vs RabbitMQ


RabbitMQ is an open-source message-broker software that originally implemented the Advanced Message Queuing Protocol (AMQP) and has since been extended with a plug-in architecture to support Streaming Text Oriented Messaging Protocol (STOMP), MQ Telemetry Transport (MQTT), and other protocols.

Written in Erlang, the RabbitMQ server is built on the Open Telecom Platform framework for clustering and failover. Client libraries to interface with the broker are available for all major programming languages. The source code is released under the Mozilla Public License.

Messaging

In RabbitMQ, messages are stored until a receiving application connects and receives a message off the queue. The client can either ack (acknowledge) the message when it receives it or when the client has completely processed the message. In either situation, once the message is acked, it’s removed from the queue.

unlike most messaging systems, the message queue in Kafka is persistent. The data sent is stored until a specified retention period has passed, either a period of time or a size limit. The message stays in the queue until the retention period/size limit is exceeded, meaning the message is not removed once it’s consumed. Instead, it can be replayed or consumed multiple times, which is a setting that can be adjusted.

Protocol

RabbitMQ supports several standardized protocols such as AMQP, MQTT, STOMP, etc, where it natively implements AMQP 0.9.1. The use of a standardized message protocol allows you to replace your RabbitMQ broker with any AMQP based broker.

Kafka uses a custom protocol, on top of TCP/IP for communication between applications and the cluster. Kafka can’t simply be removed and replaced, since its the only software implementing this protocol.

The ability of RabbitMQ to support different protocols means that it can be used in many different scenarios. The newest version of AMQP differs drastically from the officially supported release, 0.9.1. It is unlikely that RabbitMQ will deviate from AMQP 0.9.1. Version 1.0 of the protocol released on October 30, 2011 but has not gained widespread support from developers. AMQP 1.0 is available via plugin.

Pull vs Push approach

RabbitMQ is push-based, while Kafka is pull-based. With push-based systems, messages are immediately pushed to any subscribed consumer. In pull-based systems, the brokers waits for the consumer to ask for data. If a consumer is late, it can catch up later.

Routing

RabbitMQ’s benefits is the ability to flexibly route messages. Direct or regular expression-based routing allows messages to reach specific queues without additional code. RabbitMQ has four different routing options: direct, topic, fanout, and header exchanges. Direct exchanges route messages to all queues with an exact match for something called a routing key. The fanout exchange can broadcast a message to every queue that is bound to the exchange. The topics method is similar to direct as it uses a routing key but allows for wildcard matching along with exact matching.

Kafka does not support routing; Kafka topics are divided into partitions which contain messages in an unchangeable sequence. You can make use of consumer groups and persistent topics as a substitute for the routing in RabbitMQ, where you send all messages to one topic, but let your consumer groups subscribe from different offsets.

Message Priority

RabbitMQ supports priority queues, a queue can be set to have a range of priorities. The priority of each message can be set when it is published. Depending on the priority of the message it is placed in the appropriate priority queue. Here follows a simple example: We are running database backups every day, for our hosted database service. Thousands of backup events are added to RabbitMQ without order. A customer can also trigger a backup on demand, and if that happens, a new backup event is added to the queue, but with a higher priority.

A message cannot be sent with a priority level, nor be delivered in priority order, in Kafka. All messages in Kafka are stored and delivered in the order in which they are received regardless of how busy the consumer side is.

License

RabbitMQ was originally created by Rabbit Technologies Ltd. The project became part of Pivotal Software in May 2013. The source code for RabbitMQ is released under the Mozilla Public License. The license has never changed (as of Nov. 2019).

Kafka was originally created at LinkedIn. It was given open-source status and passed to the Apache Foundation in 2011. Apache Kafka is covered by the Apache 2.0 license. 

Maturity

RabbitMQ has been in the market for a longer time than Kafka – 2007 & 2011 respectively. Both RabbitMQ and Kafka are “mature”, they both are considered to be reliable and scalable messaging systems.

Ideal use case

Kafka is ideal for big data use cases that require the best throughput, while RabbitMQ is ideal for low latency message delivery, guarantees on a per-message basis, and complex routing.

Summary

ToolApache KafkaRabbitMQ
Message orderingMessages are sent to topics by message key.
Provides message ordering due to its partitioning.
Not supported.
Message lifetimeKafka persists messages and is a log, this is managed by specifying a retention policyRabbitMQ is a queue, so messages are removed once they are consumed, and acknowledgment is provided.
Delivery GuaranteesRetains order only inside a partition. In a partition, Kafka guarantees that the whole batch of messages either fails or passes.Atomicity is not guaranteed
Message prioritiesNot supportedIn RabbitMQ, priorities can be specified for consuming messages on basis of high and low priorities

References

Apache Kafka vs IBM MQ


Message Queue (MQ)

A Message Queue (MQ) is an asynchronous service-to-service communication protocol used in microservices architectures. In MQ, messages are queued until they are processed and deleted. Each message is processed only once. In addition, MQs can be used to decouple heavyweight processing, buffering, and batch work.

Apache Kafka

Apache Kafka was originally developed at Linkedin as a stream processing platform before being open-sourced and gaining large external demand. Later, the Kafka project was handled by the Apache Software Foundation. Today, Apache Kafka is widely known as an open-source message broker and a distributed data storage platform written in Scala.

It provides services in a distributed, highly scalable, elastic, fault-tolerant, and secure manner. Options are available to self manage your kafka environments or fully managed services offered by vendors. It can be deployed on bare-metal hardware, virtual machines, and containers in on-premise as well as cloud environments.

IBM MQ

IBM MQ is a messaging middleware that integrates various business applications and data across multiple platforms faster and easier. It provides enterprise-grade messaging capabilities with a proven record for expertly and securely moving data. Indeed, apps can communicate with the aid of IBM MQ. By transmitting message data via messaging queues, IBM MQ makes exchanging information easier for applications, services, systems, and files. This dramatically simplifies the process of developing and maintaining business applications.

Additionally, IBM MQ fits into several environments, such as on-premise, cloud, and hybrid cloud deployments, and is compatible with a broad range of computing systems. It also offers a global messaging backbone with a service-oriented architecture (SOA).

Integration

Initial set up for both IBM MQ & Kafka is straightforward and has good documentation & community support

Communication

Pull based communication is used in Kafka where receiving system send a message request to producing system. IBM MQ utilizes push based communication where it pushes the message to the queue where any receiver can consume at the same time from multiple systems

Cost

Kafka is an open-source solution. IBM MQ is a paid platform. IBM MQs has good customer support. Kafka on the other hand provides paid assistance based on subscription system but there is good open-source community as it is fairly popular messaging solutions

Security

IBM MQ offers a range of advanced capabilities such as enhanced granular security and message simplification capability while Apache Kafka do not. However, both provide superior security features to build data sensitive, mission critical applications

In Apache Kafka, messages are not erased once the receiving system has read them. Hence, it is easier to log events

Performance

  • Both Kafka and MQ can be horizontally scaled. But Kafka is more scalable with the number of consumers as it uses the single log file for all consumers
  • IBM MQ is suited for applications which require high reliability and do not tolerate message loss where as Kafka is suited for applications which requires high throughput
  • Apache Kafka can get a message from one system to it’s receiver quickly compared to traditional message queue tools, but each receiver must make a request for the message, rather than the producing system placing the message into an accessible queue.  Additionally, while Apache Kafka can be used to log events and scales well, it doesn’t include as many granular features for security and message simplification. 

References

Apache Kafka – Java Producer & Consumer


Apache Kakfa is an opensource distributed event streaming platform which works based on publish/subscribe messaging system. That means, there would be a producer who publishes messages to Kafka and a consumer who reads messages from Kafka. In between, Kafka acts like a filesystem or database commit log.

In this article we will discuss about writing a Kafka producer and consumer using Java with customized serialization and deserializations.

Kakfa Producer Application:

Producer is the one who publish the messages to Kafka topic. Topic is a partitioner in Kafka environment, it is very similar to a folder in a file system. In the below example program, messages are getting published to Kafka topic ‘kafka-message-count-topic‘.

package com.malliktalksjava.kafka.producer;

import java.util.Properties;
import java.util.concurrent.ExecutionException;

import com.malliktalksjava.kafka.constants.KafkaConstants;
import com.malliktalksjava.kafka.util.CustomPartitioner;
import org.apache.kafka.clients.producer.*;
import org.apache.kafka.common.serialization.LongSerializer;
import org.apache.kafka.common.serialization.StringSerializer;
import org.slf4j.Logger;
import org.slf4j.LoggerFactory;

public class KafkaSampleProducer {

    static Logger log = LoggerFactory.getLogger(KafkaSampleProducer.class);

    public static void main(String[] args) {
        runProducer();
    }

    static void runProducer() {
        Producer<Long, String> producer = createProducer();

        for (int index = 0; index < KafkaConstants.MESSAGE_COUNT; index++) {
            ProducerRecord<Long, String> record = new ProducerRecord<Long, String>(KafkaConstants.TOPIC_NAME,
                    "This is record " + index);
            try {
                RecordMetadata metadata = producer.send(record).get();
                //log.info("Record sent with key " + index + " to partition " + metadata.partition() +
                 //       " with offset " + metadata.offset());
                System.out.println("Record sent with key " + index + " to partition " + metadata.partition() +
                        " with offset " + metadata.offset());
            } catch (ExecutionException e) {
                log.error("Error in sending record", e);
                e.printStackTrace();
            } catch (InterruptedException e) {
                log.error("Error in sending record", e);
                e.printStackTrace();
            }
        }
    }

    public static Producer<Long, String> createProducer() {
        Properties props = new Properties();
        props.put(ProducerConfig.BOOTSTRAP_SERVERS_CONFIG, KafkaConstants.KAFKA_BROKERS);
        props.put(ProducerConfig.CLIENT_ID_CONFIG, KafkaConstants.CLIENT_ID);
        props.put(ProducerConfig.KEY_SERIALIZER_CLASS_CONFIG, LongSerializer.class.getName());
        props.put(ProducerConfig.VALUE_SERIALIZER_CLASS_CONFIG, StringSerializer.class.getName());
        props.put(ProducerConfig.PARTITIONER_CLASS_CONFIG, CustomPartitioner.class.getName());
        return new KafkaProducer<>(props);
    }
}

Kakfa Consumer Program:

Consumer is the one who subscribe to Kafka topic to read the messages. There are different ways to read the messages from Kafka, below example polls the topic for every thousend milli seconds to fetch the messages from Kafka.

package com.malliktalksjava.kafka.consumer;

import java.util.Collections;
import java.util.Properties;

import com.malliktalksjava.kafka.constants.KafkaConstants;
import com.malliktalksjava.kafka.producer.KafkaSampleProducer;
import org.apache.kafka.clients.consumer.Consumer;
import org.apache.kafka.clients.consumer.ConsumerConfig;
import org.apache.kafka.clients.consumer.KafkaConsumer;
import org.apache.kafka.common.serialization.LongDeserializer;
import org.apache.kafka.common.serialization.StringDeserializer;

import org.apache.kafka.clients.consumer.ConsumerRecords;
import org.slf4j.Logger;
import org.slf4j.LoggerFactory;

public class KafkaSampleConsumer {
    static Logger log = LoggerFactory.getLogger(KafkaSampleProducer.class);

    public static void main(String[] args) {
        runConsumer();
    }

    static void runConsumer() {
        Consumer<Long, String> consumer = createConsumer();
        int noMessageFound = 0;
        while (true) {
            ConsumerRecords<Long, String> consumerRecords = consumer.poll(1000);
            // 1000 is the time in milliseconds consumer will wait if no record is found at broker.
            if (consumerRecords.count() == 0) {
                noMessageFound++;
                if (noMessageFound > KafkaConstants.MAX_NO_MESSAGE_FOUND_COUNT)
                    // If no message found count is reached to threshold exit loop.
                    break;
                else
                    continue;
            }

            //print each record.
            consumerRecords.forEach(record -> {
                System.out.println("Record Key " + record.key());
                System.out.println("Record value " + record.value());
                System.out.println("Record partition " + record.partition());
                System.out.println("Record offset " + record.offset());
            });

            // commits the offset of record to broker.
            consumer.commitAsync();
        }
        consumer.close();
    }

        public static Consumer<Long, String> createConsumer() {
            Properties props = new Properties();
            props.put(ConsumerConfig.BOOTSTRAP_SERVERS_CONFIG, KafkaConstants.KAFKA_BROKERS);
            props.put(ConsumerConfig.GROUP_ID_CONFIG, KafkaConstants.GROUP_ID_CONFIG);
            props.put(ConsumerConfig.KEY_DESERIALIZER_CLASS_CONFIG, LongDeserializer.class.getName());
            props.put(ConsumerConfig.VALUE_DESERIALIZER_CLASS_CONFIG, StringDeserializer.class.getName());
            props.put(ConsumerConfig.MAX_POLL_RECORDS_CONFIG, KafkaConstants.MAX_POLL_RECORDS);
            props.put(ConsumerConfig.ENABLE_AUTO_COMMIT_CONFIG, "false");
            props.put(ConsumerConfig.AUTO_OFFSET_RESET_CONFIG, KafkaConstants.OFFSET_RESET_EARLIER);

            Consumer<Long, String> consumer = new KafkaConsumer<>(props);
            consumer.subscribe(Collections.singletonList(KafkaConstants.TOPIC_NAME));
            return consumer;
        }
}

Messages will be published to a Kafka partition called Topic. A Kafka topic is sub-divided into units called partitions for fault tolerance and scalability.

Every Record in Kafka has key value pairs, while publishing messages key is optional. If you don’t pass the key, Kafka will assign its own key for each message. In Above example, ProducerRecord<Integer, String> is the message that published to Kafka has Integer type as key and String as value.

Message Model Class: Below model class is used to publish the object. Refer to below descriptions on how this class being used in the application.

package com.malliktalksjava.kafka.model;

import java.io.Serializable;

public class Message implements Serializable{

    private static final long serialVersionUID = 1L;

    private String id;
    private String name;

    public String getId() {
        return id;
    }

    public void setId(String id) {
        this.id = id;
    }

    public String getName() {
        return name;
    }

    public void setName(String name) {
        this.name = name;
    }
}

Constants class: All the constants related to this application have been placed into below class.

package com.malliktalksjava.kafka.constants;

public class KafkaConstants {

    public static String KAFKA_BROKERS = "localhost:9092";

    public static Integer MESSAGE_COUNT=100;

    public static String CLIENT_ID="client1";

    public static String TOPIC_NAME="kafka-message-count-topic";

    public static String GROUP_ID_CONFIG="consumerGroup1";

    public static String GROUP_ID_CONFIG_2 ="consumerGroup2";

    public static Integer MAX_NO_MESSAGE_FOUND_COUNT=100;

    public static String OFFSET_RESET_LATEST="latest";

    public static String OFFSET_RESET_EARLIER="earliest";

    public static Integer MAX_POLL_RECORDS=1;
}

Custom Serializer: Serializer is the class which converts java objects to write into disk. Below custom serializer is converting the Message object to JSON String. Serialized message will be placed into Kafka Topic, this message can’t be read until it is deserialized by the consumer.

package com.malliktalksjava.kafka.util;

import java.util.Map;
import com.malliktalksjava.kafka.model.Message;
import org.apache.kafka.common.serialization.Serializer;
import com.fasterxml.jackson.databind.ObjectMapper;

public class CustomSerializer implements Serializer<Message> {

    @Override
    public void configure(Map<String, ?> configs, boolean isKey) {

    }

    @Override
    public byte[] serialize(String topic, Message data) {
        byte[] retVal = null;
        ObjectMapper objectMapper = new ObjectMapper();
        try {
            retVal = objectMapper.writeValueAsString(data).getBytes();
        } catch (Exception exception) {
            System.out.println("Error in serializing object"+ data);
        }
        return retVal;
    }
    @Override
    public void close() {

    }
}

Custom Deserializer: Below custom deserializer, converts the serealized object coming from Kafka into Java object.

package com.malliktalksjava.kafka.util;

import java.util.Map;

import com.malliktalksjava.kafka.model.Message;
import org.apache.kafka.common.serialization.Deserializer;

import com.fasterxml.jackson.databind.ObjectMapper;

public class CustomObjectDeserializer implements Deserializer<Message> {

    @Override
    public void configure(Map<String, ?> configs, boolean isKey) {
    }

    @Override
    public Message deserialize(String topic, byte[] data) {
        ObjectMapper mapper = new ObjectMapper();
        Message object = null;
        try {
            object = mapper.readValue(data, Message.class);
        } catch (Exception exception) {
            System.out.println("Error in deserializing bytes "+ exception);
        }
        return object;
    }

    @Override
    public void close() {
    }
}

Custom Partitioner: If you would like to do any custom settings for Kafka, you can do that using the java code. Below is the sample custom partitioner created as part of this applicaiton.

package com.malliktalksjava.kafka.util;

import org.apache.kafka.clients.producer.Partitioner;
import org.apache.kafka.common.Cluster;
import java.util.Map;

public class CustomPartitioner implements Partitioner{

    private static final int PARTITION_COUNT=50;

    @Override
    public void configure(Map<String, ?> configs) {

    }

    @Override
    public int partition(String topic, Object key, byte[] keyBytes, Object value, byte[] valueBytes, Cluster cluster) {
        Integer keyInt=Integer.parseInt(key.toString());
        return keyInt % PARTITION_COUNT;
    }

    @Override
    public void close() {
    }
}

Here is the GIT Hub link for the program: https://github.com/mallikarjungunda/kafka-producer-consumer

Hope you liked the details, please share your feedback in comments.

ReactJs basic application creation


React is one of the popular java script library used to build user interfaces in web applications. 

As per Reactjs.orgReact is a declarative, efficient, and flexible JavaScript library for building user interfaces. It lets you compose complex UIs from small and isolated pieces of code called “components”.

In this tutorial, we would like to understand on how to create a basic react application using command line. You need to have nodejs installed into your desktop or laptop to create reactjs based application.

Navigate to your workspace folder(folder where you want to create project) in command/terminal prompt. Type below command to create basic react application with the folder name as malliktalksjava.

npx create-react-app malliktalksjava

Move to react application folder using below command.

cd malliktalksjava/

Start the application using below command.

npm start

Access localhost URL, http://localhost:3000/. React basic application will be displayed as given below.

React JS_Hello World App

This basic application doesn’t handle back-end logic or databases; it just creates a front-end build pipeline, so you can use it with any back-end you want. But, it installs Babel and webpack behind the scenes, below is the purpose of Babel and webpack:

Babel is a JavaScript compiler and transpiler, used to convert one source code to other. You will be able to use the new ES6 features in your code where, babel converts it into plain old ES5 which can be run on all browsers.

Webpack is a module bundler, it takes dependent modules and compiles them to a single bundle file. You can use this bundle while developing apps using command line or, by configuring it using webpack.config file.


Apache Kafka – Environment Setup


Apache Kakfa is an opensource distributed event streaming platform which works based on publish/subscribe messaging system. That means, there would be a producer who publishes messages to Kafka and a consumer who reads messages from Kafka. In between, Kafka acts like a filesystem or database commit log.

In this post we will setup kafka local environment, create topic, publish and consume messages using console clients.

Step 1: Download latest version of Apache Kafka from Apache Kafka website: https://kafka.apache.org/downloads.

Extract the folder into your local and navigate to the folder in Terminal session (if Mac) or command line (if windows):

$ tar -xzf kafka_2.13-3.1.0.tgz 
$ cd kafka_2.13-3.1.0

Step 2: Run Kafka in your local:

Run zookeeper using the below command terminal/command line window 1:

# Start the ZooKeeper service
$ bin/zookeeper-server-start.sh config/zookeeper.properties

Run Kafka using the below command in another terminal or command line:

# Start the Kafka broker service
$ bin/kafka-server-start.sh config/server.properties

Note: You must have Java8 or above in your machine to run Kafka.

Once above two services are run successfully in local, you are set with running Kafka in your local machine.

Step 3: Create topic in Kafka to produce/consume the message in another terminal or command like. In below example, topic name is ‘order-details’ and kafka broker is running in my localhost 9092 port.

$ bin/kafka-topics.sh --create --topic order-details --bootstrap-server localhost:9092

If needed, use describe topic to understand more details about topic created above:

$ bin/kafka-topics.sh --describe --topic order-details --bootstrap-server localhost:9092

Output looks like below:
Topic: order-details	PartitionCount: 1	ReplicationFactor: 1	Configs: segment.bytes=1073741824
	Topic: order-details	Partition: 0	Leader: 0	Replicas: 0	Isr: 0

Step 4: Write events to topic

Run the console producer client to write a few events into your topic. By default, each line you enter will result in a separate event being written to the topic.

$ bin/kafka-console-producer.sh --topic order-details --bootstrap-server localhost:9092
Order 1 details
Order 2 details

Step 5: Read events from Kafka

Open another terminal session/command line and run the console consumer client to read the events you just created:

$ bin/kafka-console-consumer.sh --topic order-details --from-beginning --bootstrap-server localhost:9092
Order 1 details
Order 2 details

Conclusion:

By completing all the above steps, you learned about setting up kafka environment, creating topics, producing the messages using console producer and consming the message using console consumer.